|
Comprehensive suite of tools designed for research and financial analysis
Equity Dashboard
Professional Charting
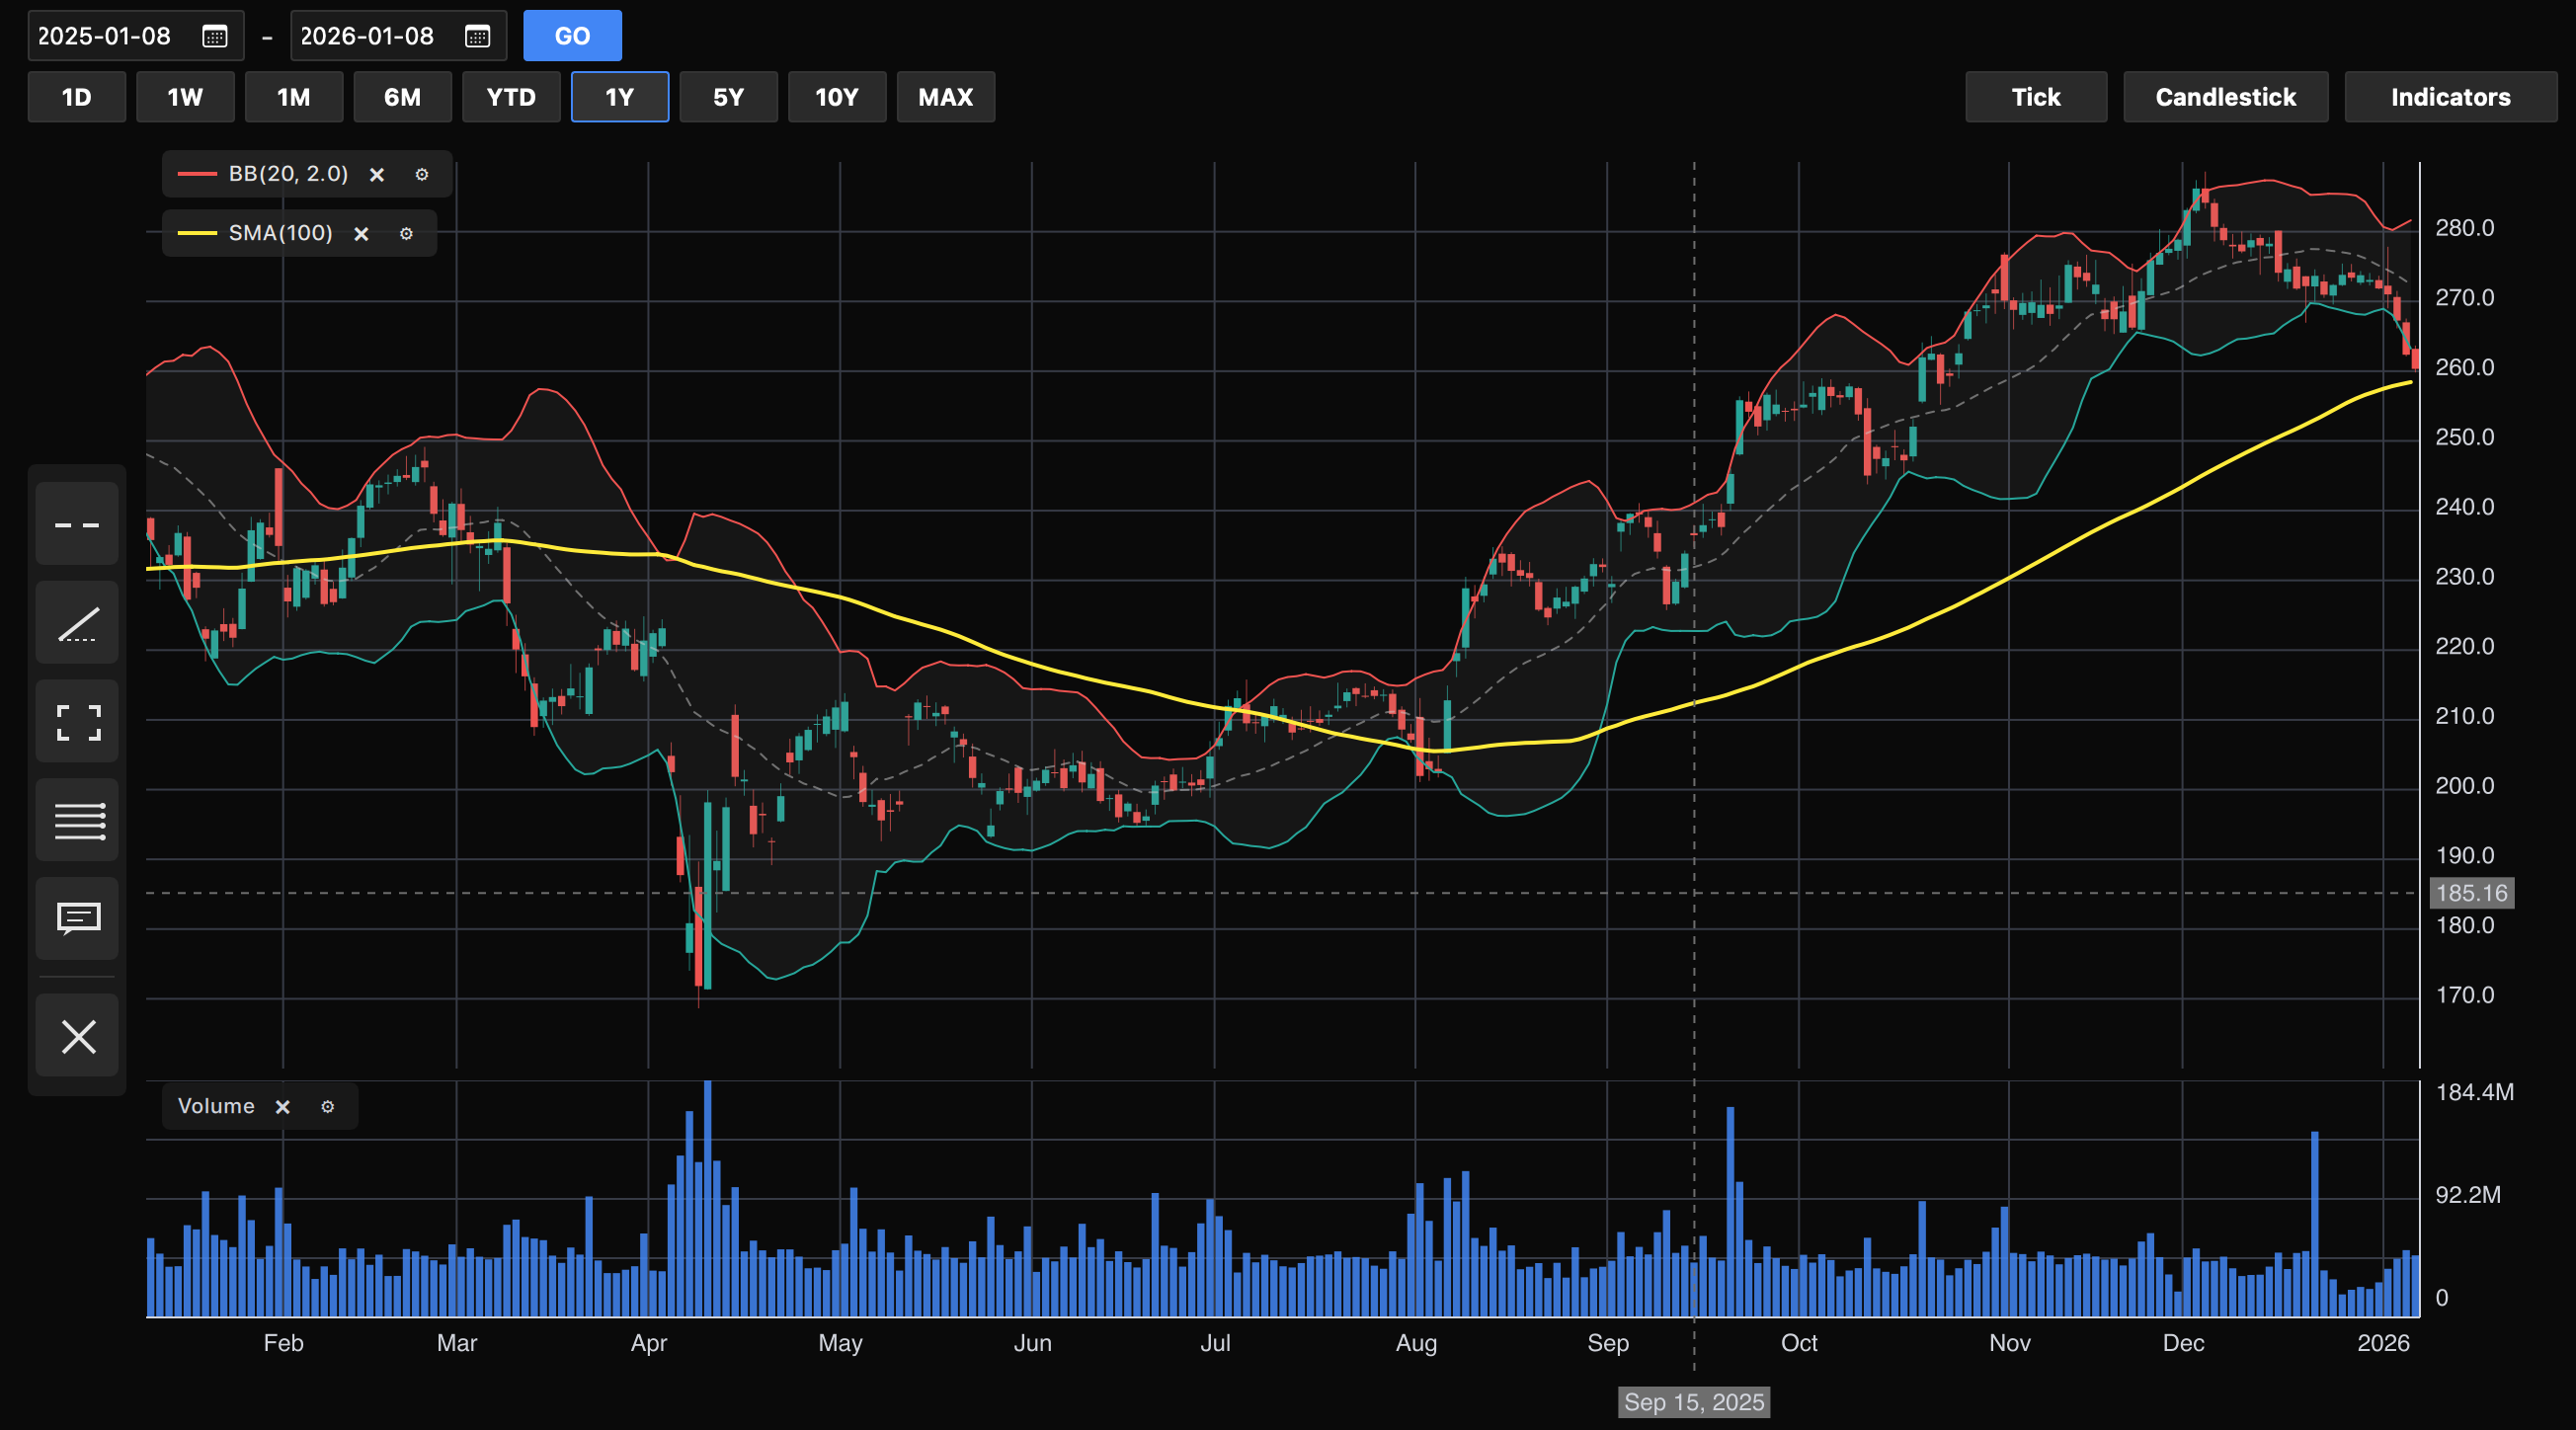
- Candlestick, line, area, and OHLC chart types
- Technical indicators (RSI, MACD, Bollinger Bands)
- Professional drawing and annotation tools
- Multi-timeframe analysis
Financial Statements
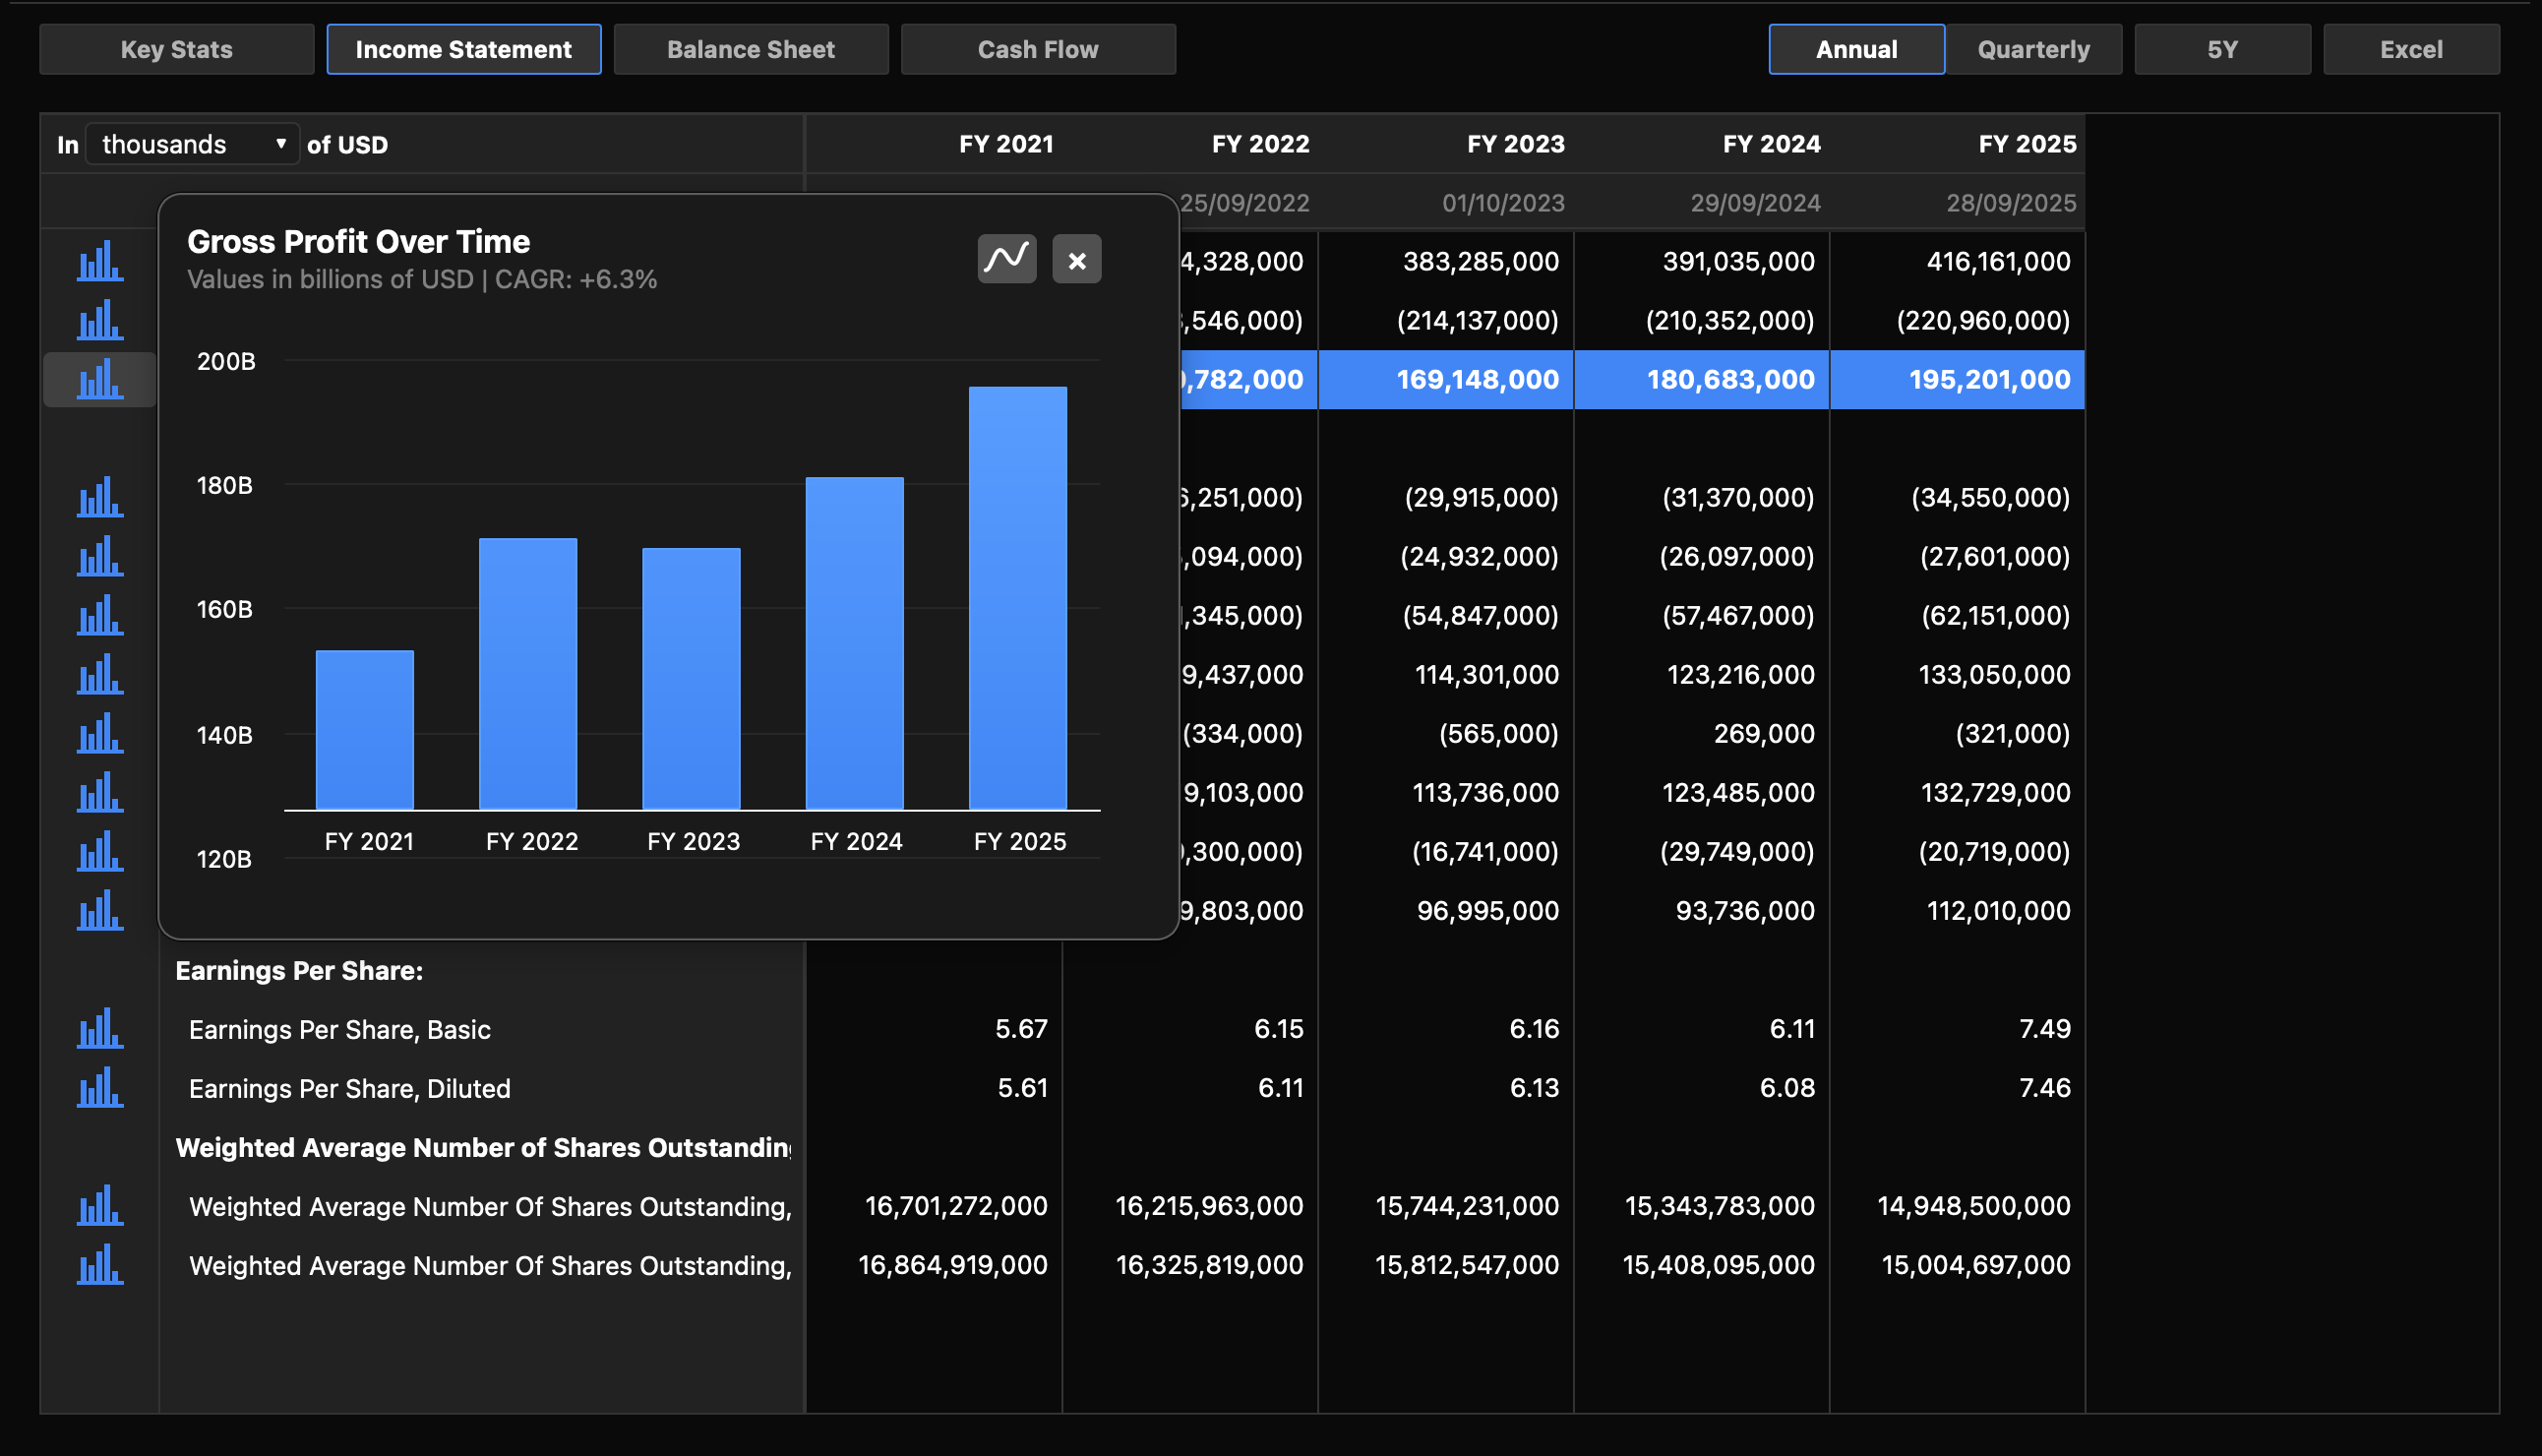
- Income, balance sheet, and cash flow statements
- Direct SEC EDGAR and ESEF integration
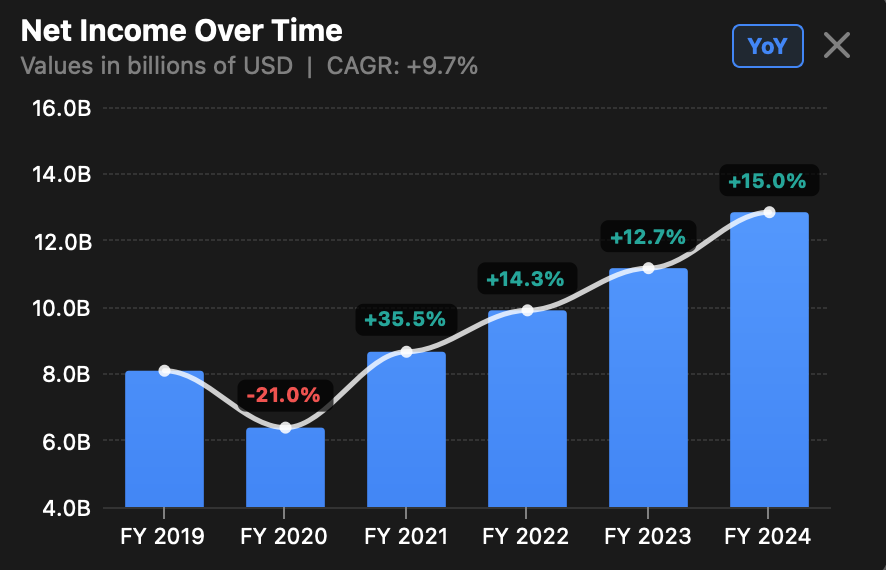
- Key statistics calculations over time
- Export to Excel and PDF
Peer Comparison

- Automatic peer group identification
- Multi-metric comparison tables
- Custom chart builder for comparisons
- Relative valuation analysis
Risk Analysis
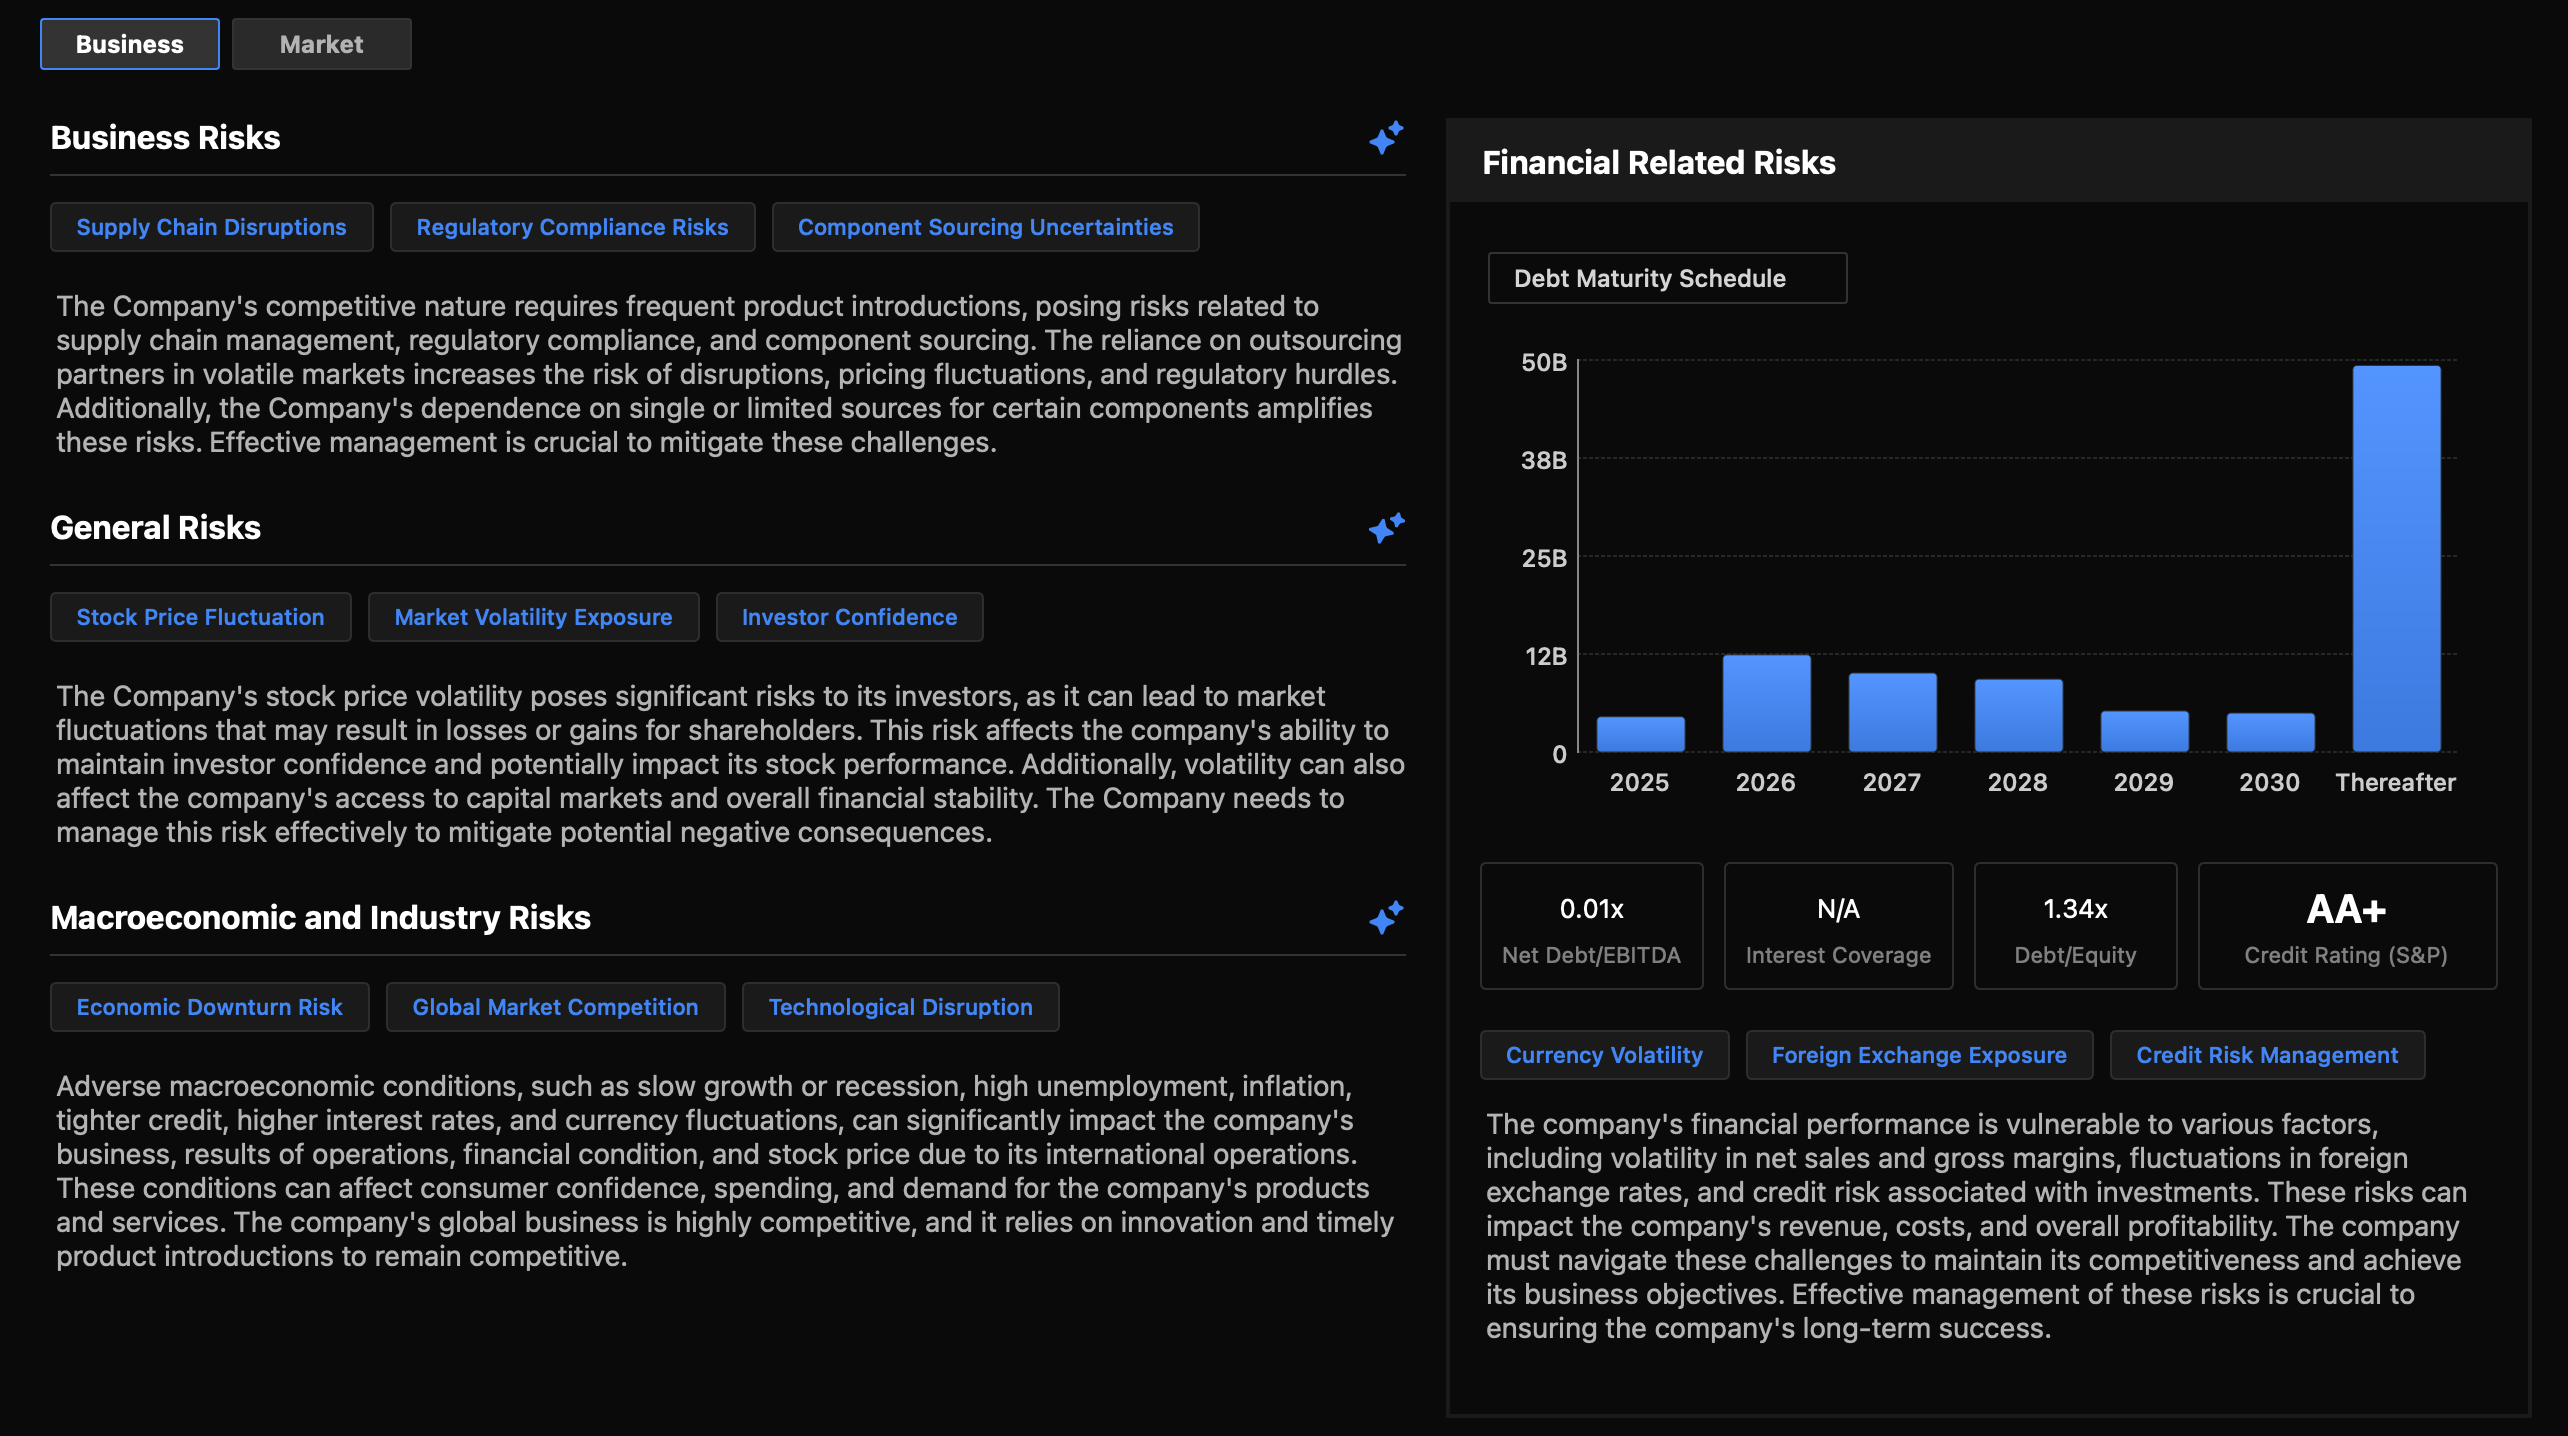
- AI-powered risk factor summaries
- Automatic SEC risk extraction
- Rolling volatility and drawdown tracking
- Insider activity monitoring
Financial Analytics
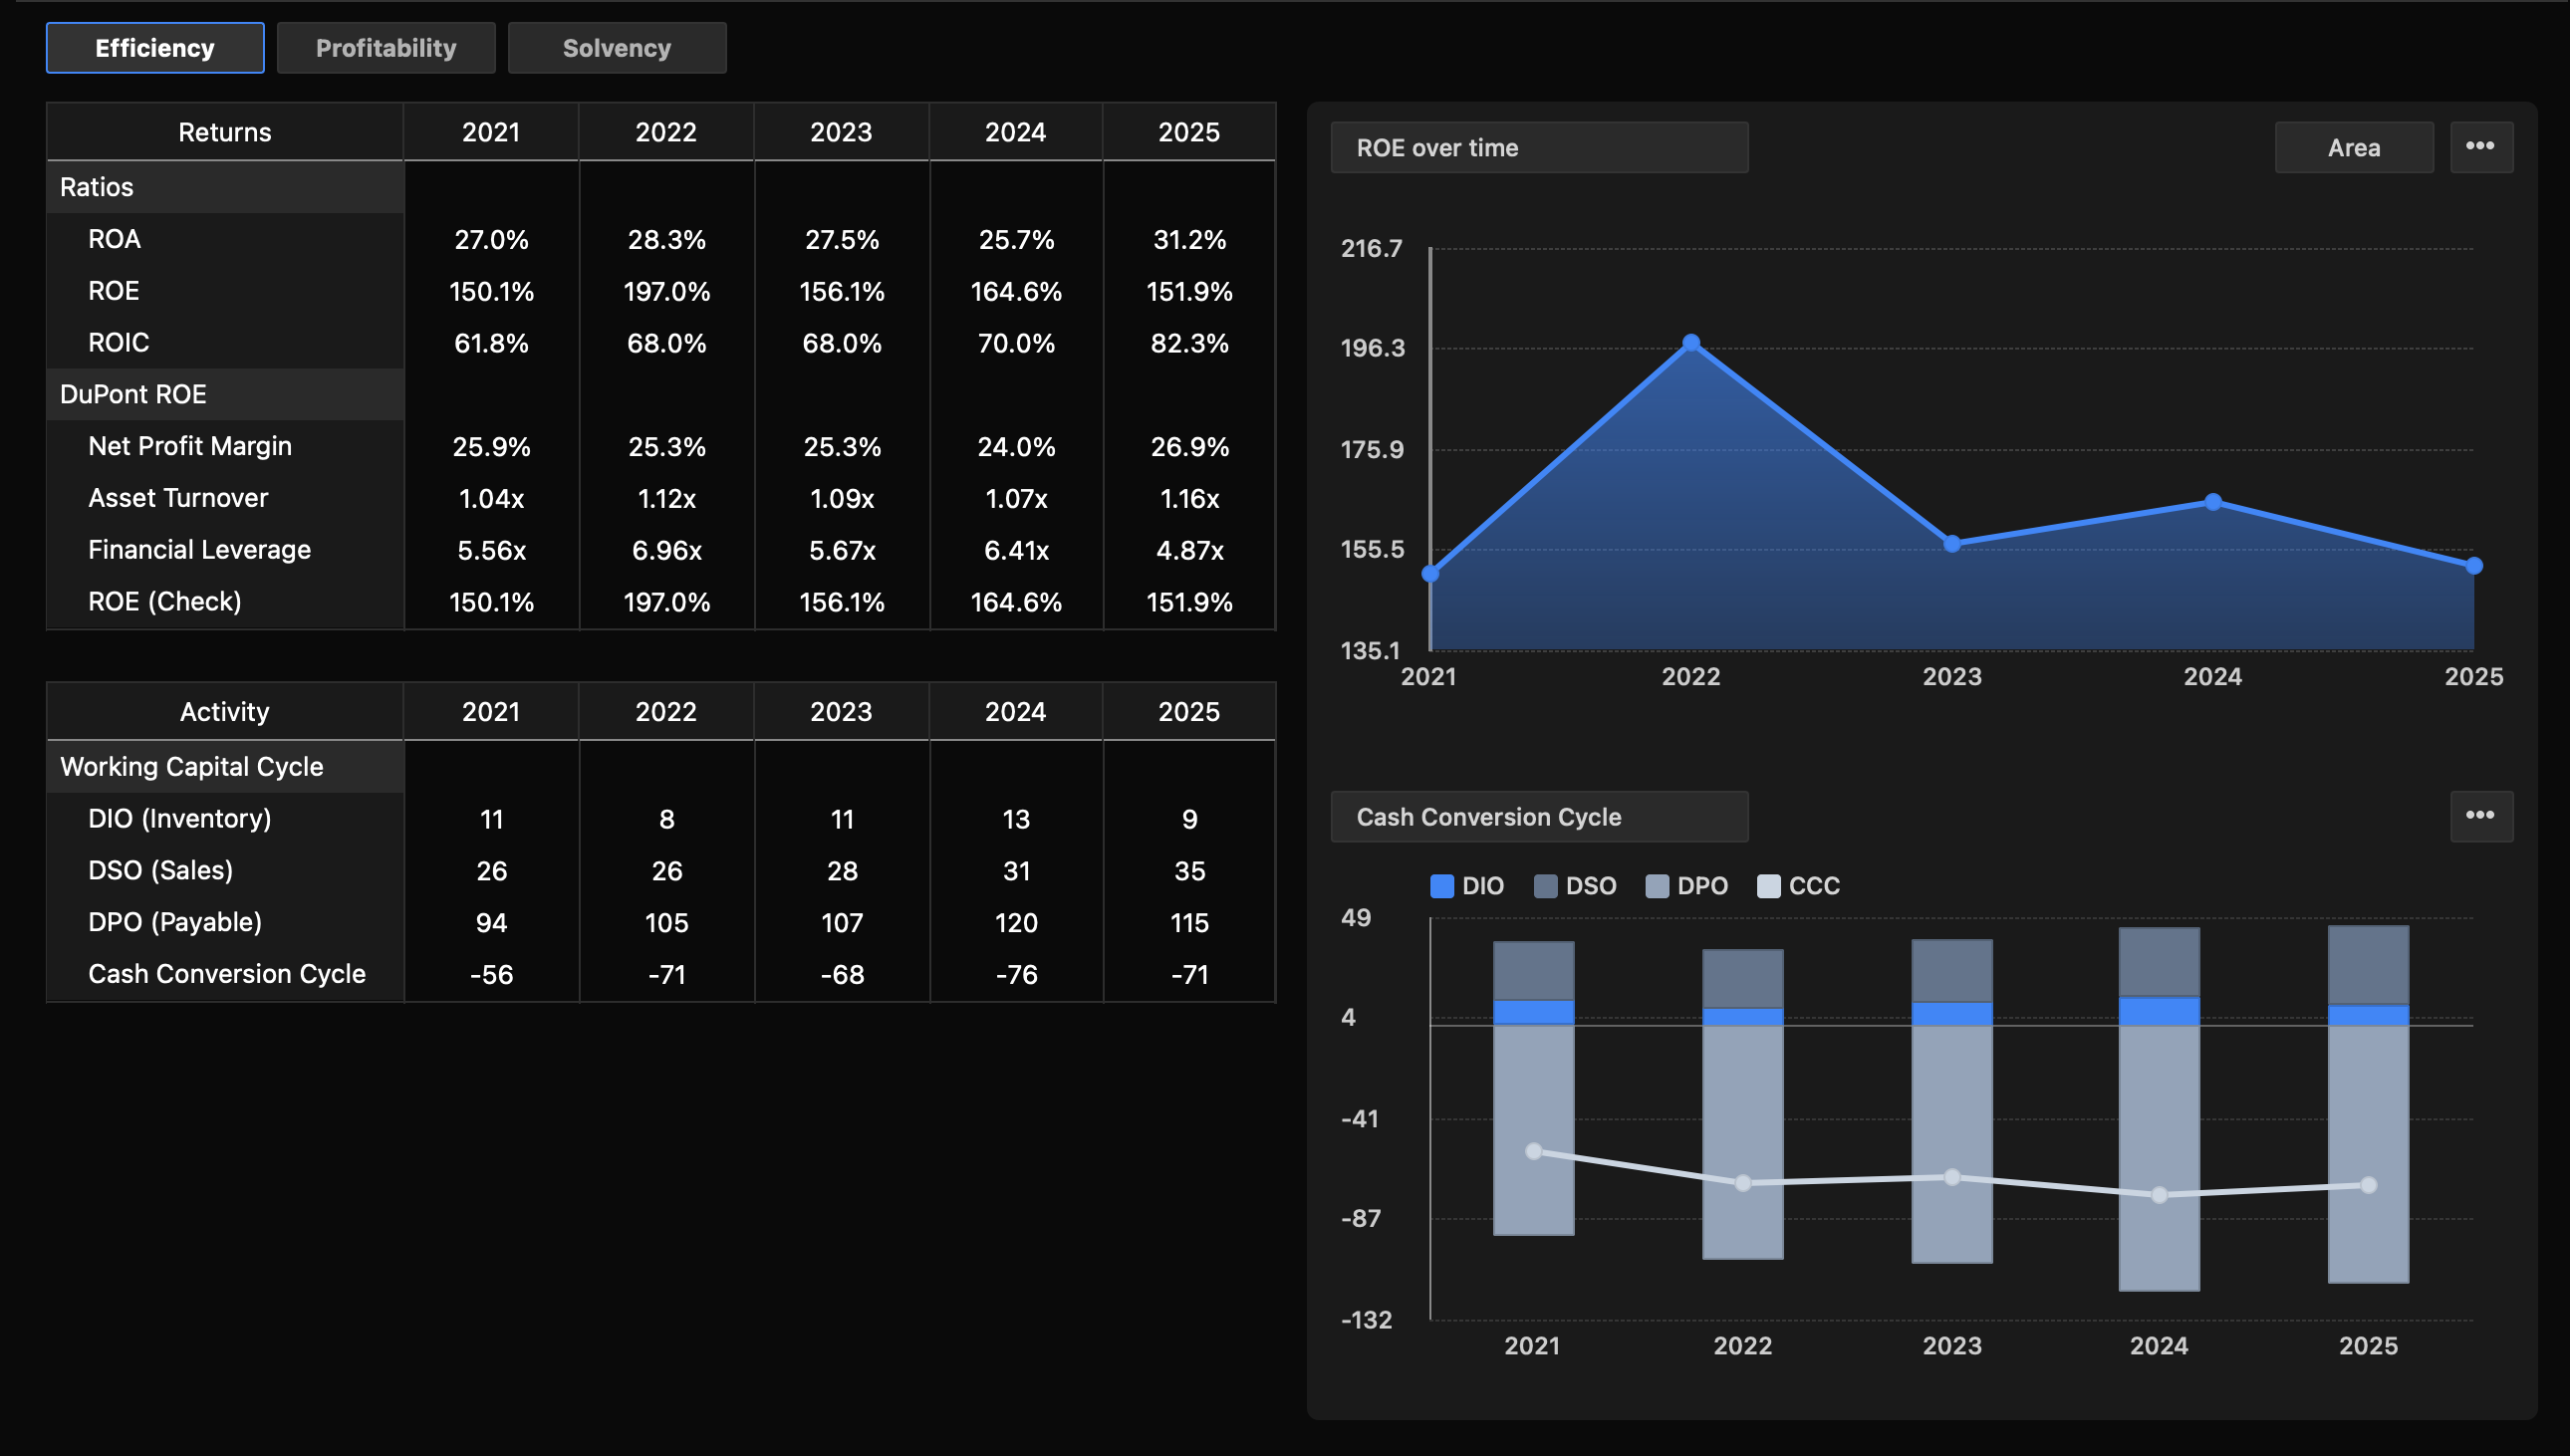
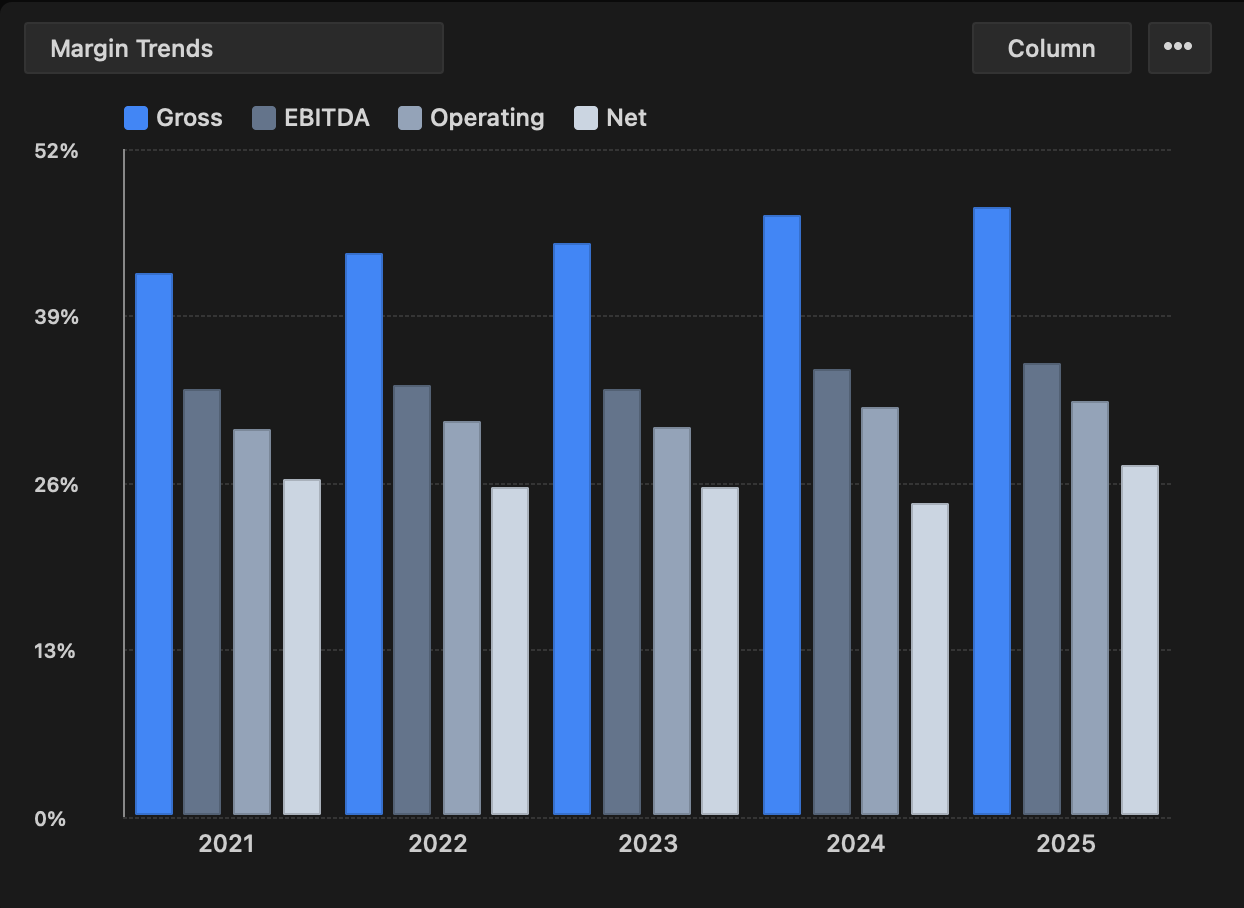
- Efficiency, solvency, and profitability ratios
- Trend analysis with historical comparison
- Industry benchmarks
- Custom ratio calculations
Valuation
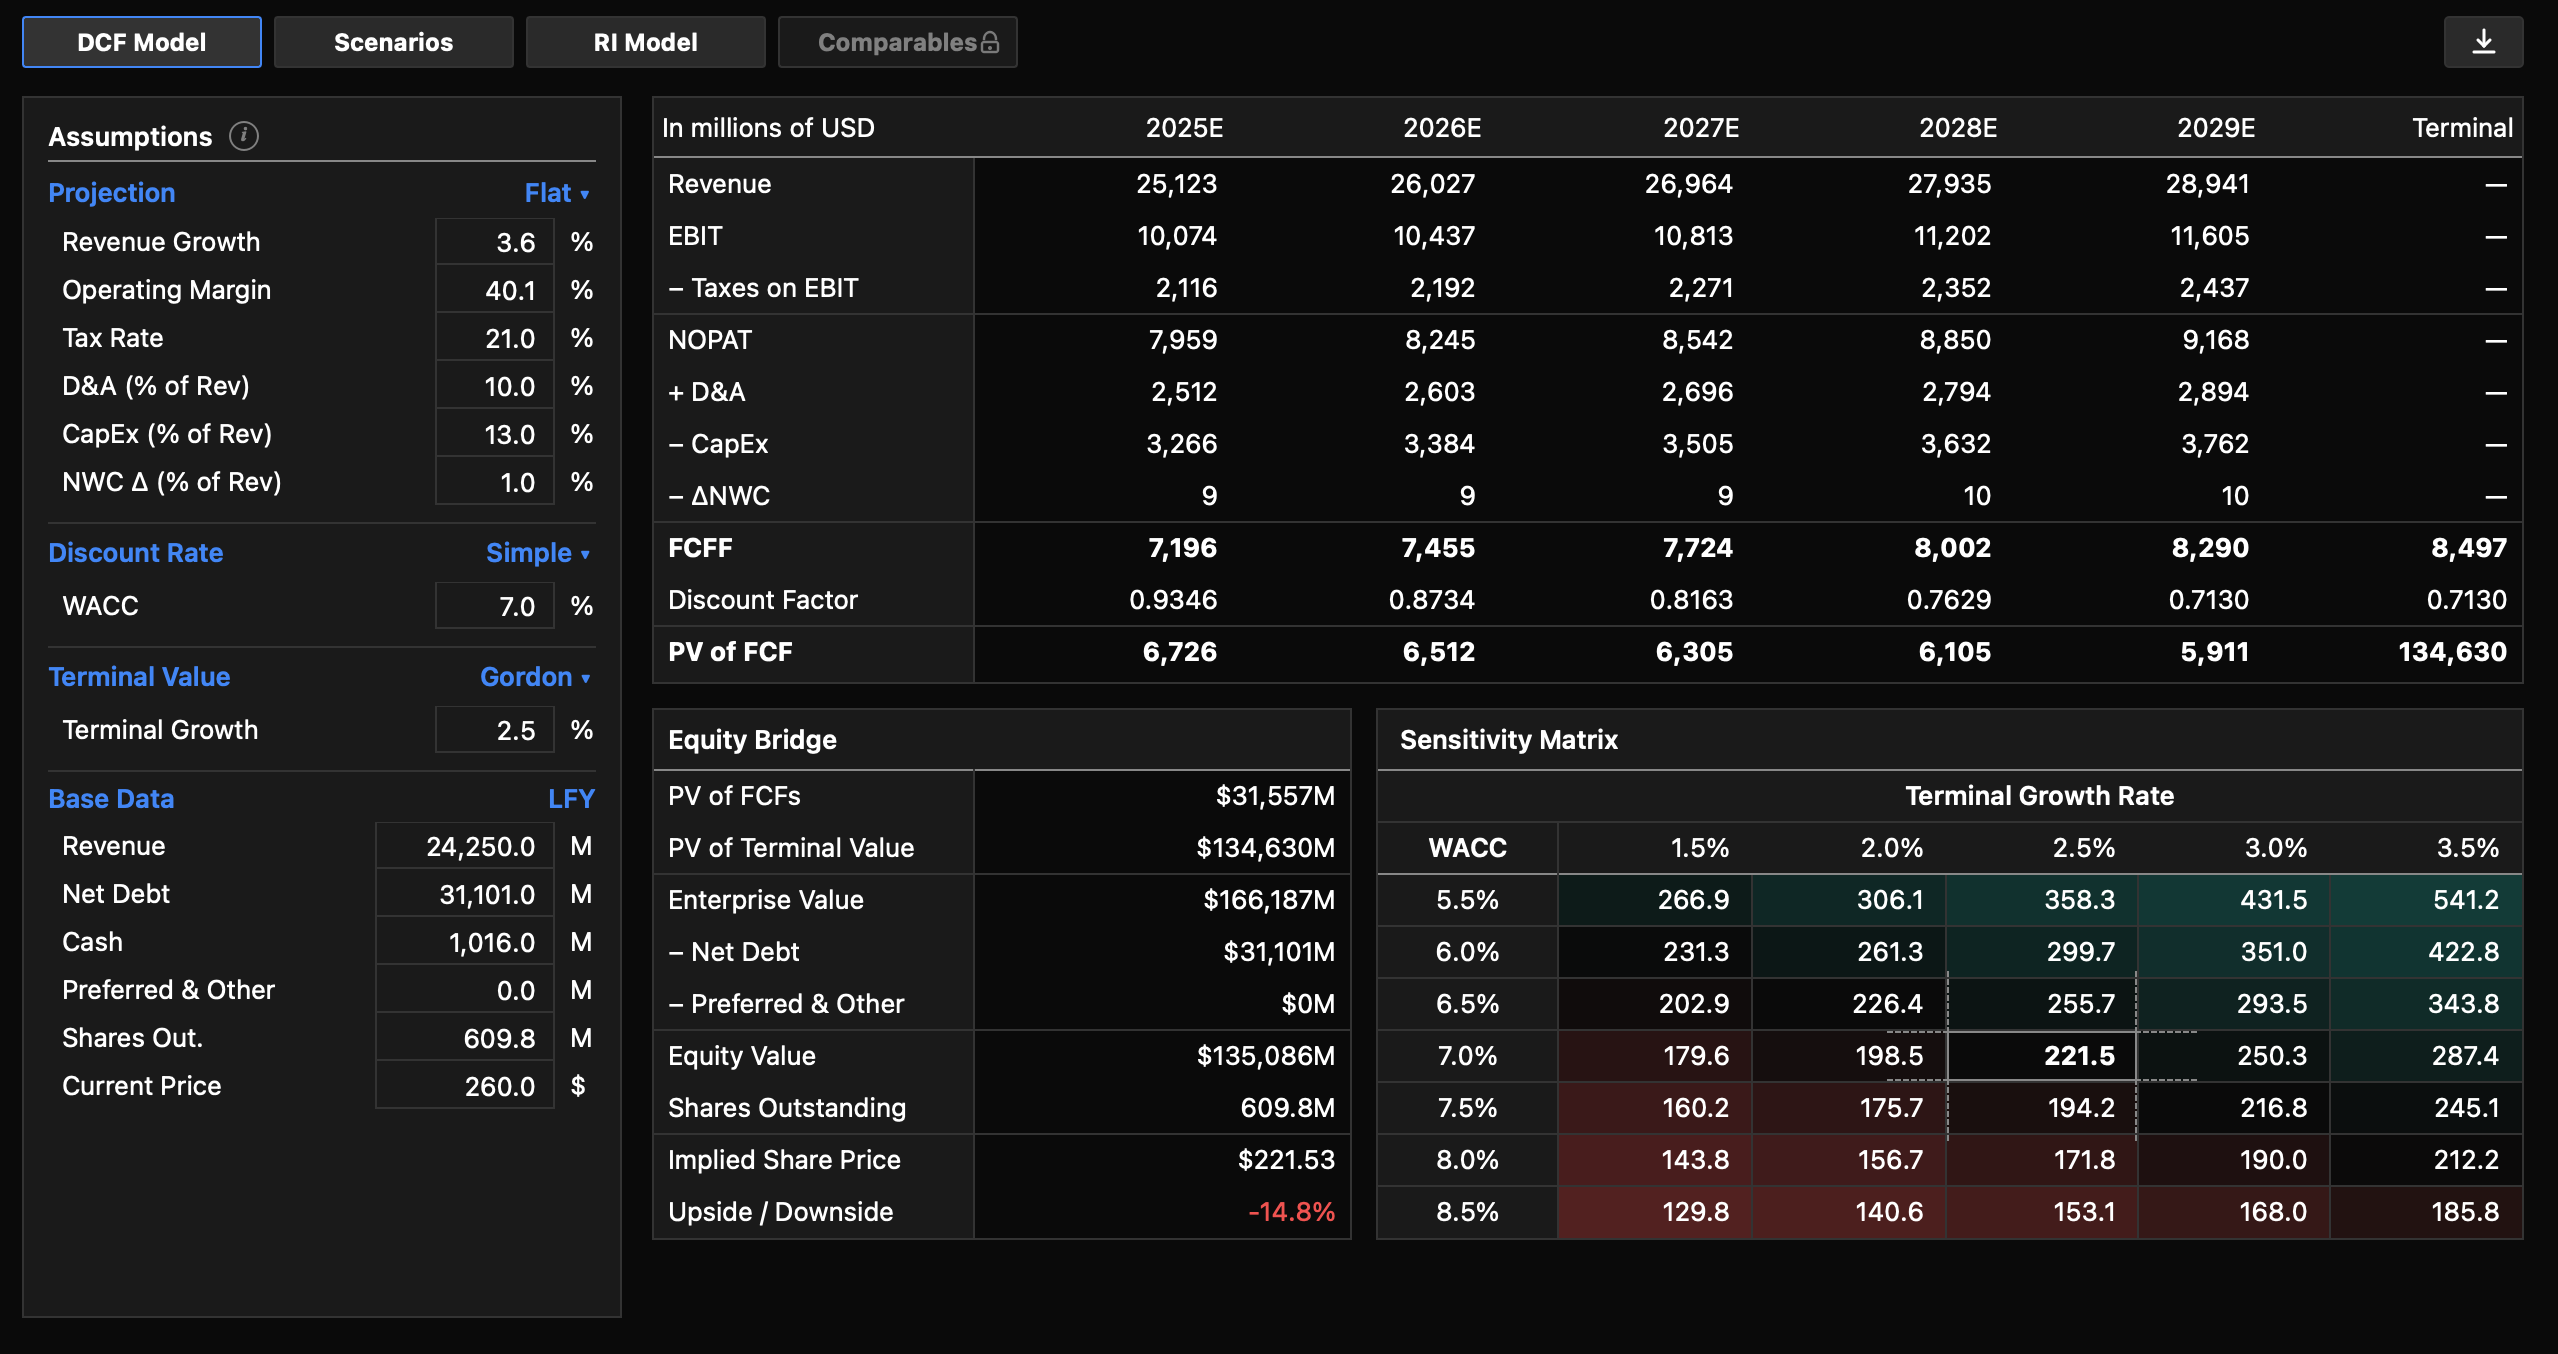
- DCF model builder with customizable inputs
- Pre-filled assumptions from financials
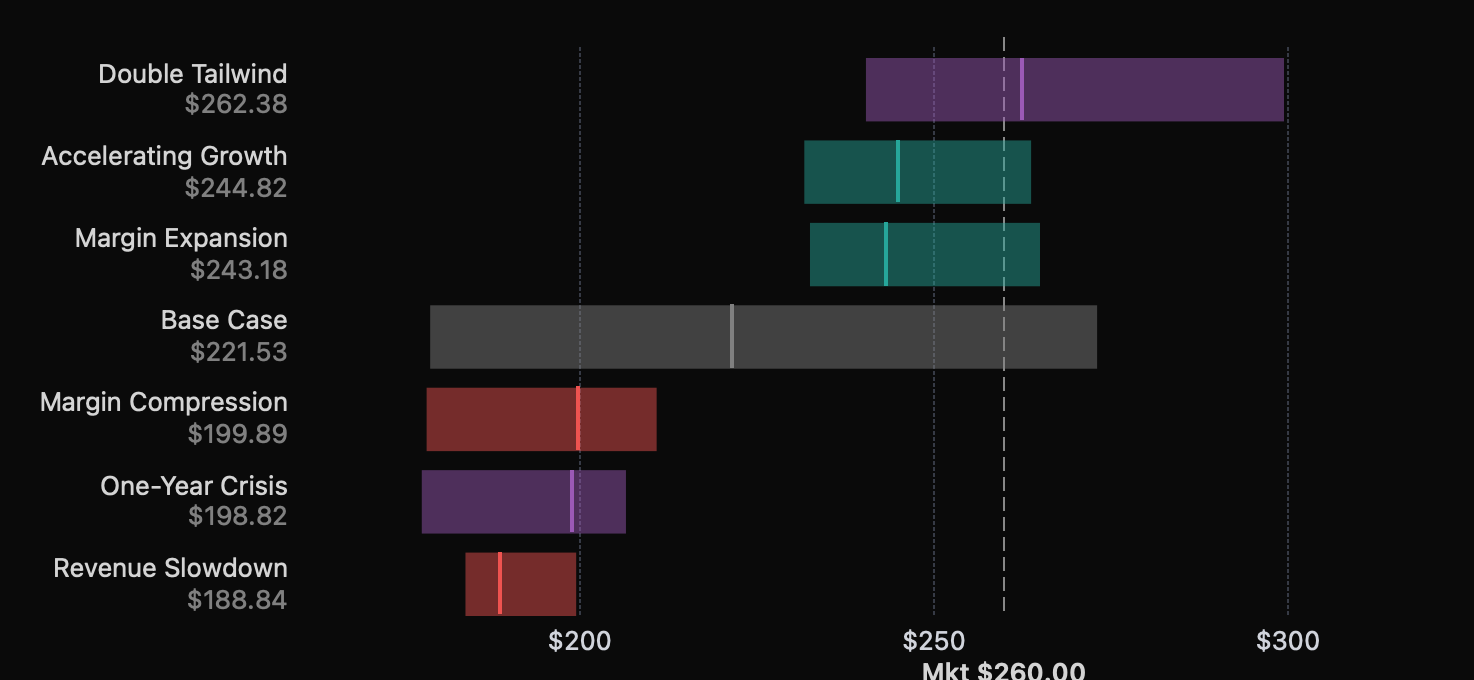
- Multiple valuation methods comparison
- Sensitivity analysis
- ML-powered earnings prediction engine
Data Tracker
Multi-Dimensional Data Tracking
- Macroeconomic indicators tracking
- Climate and environmental data
- Geopolitical events monitoring
- Custom data point integration
Portfolio Management Coming Soon
Portfolio Overview
- Multi-portfolio tracking
- P&L visualization
- Risk analytics
- Scenario analysis
Tools
Calculators
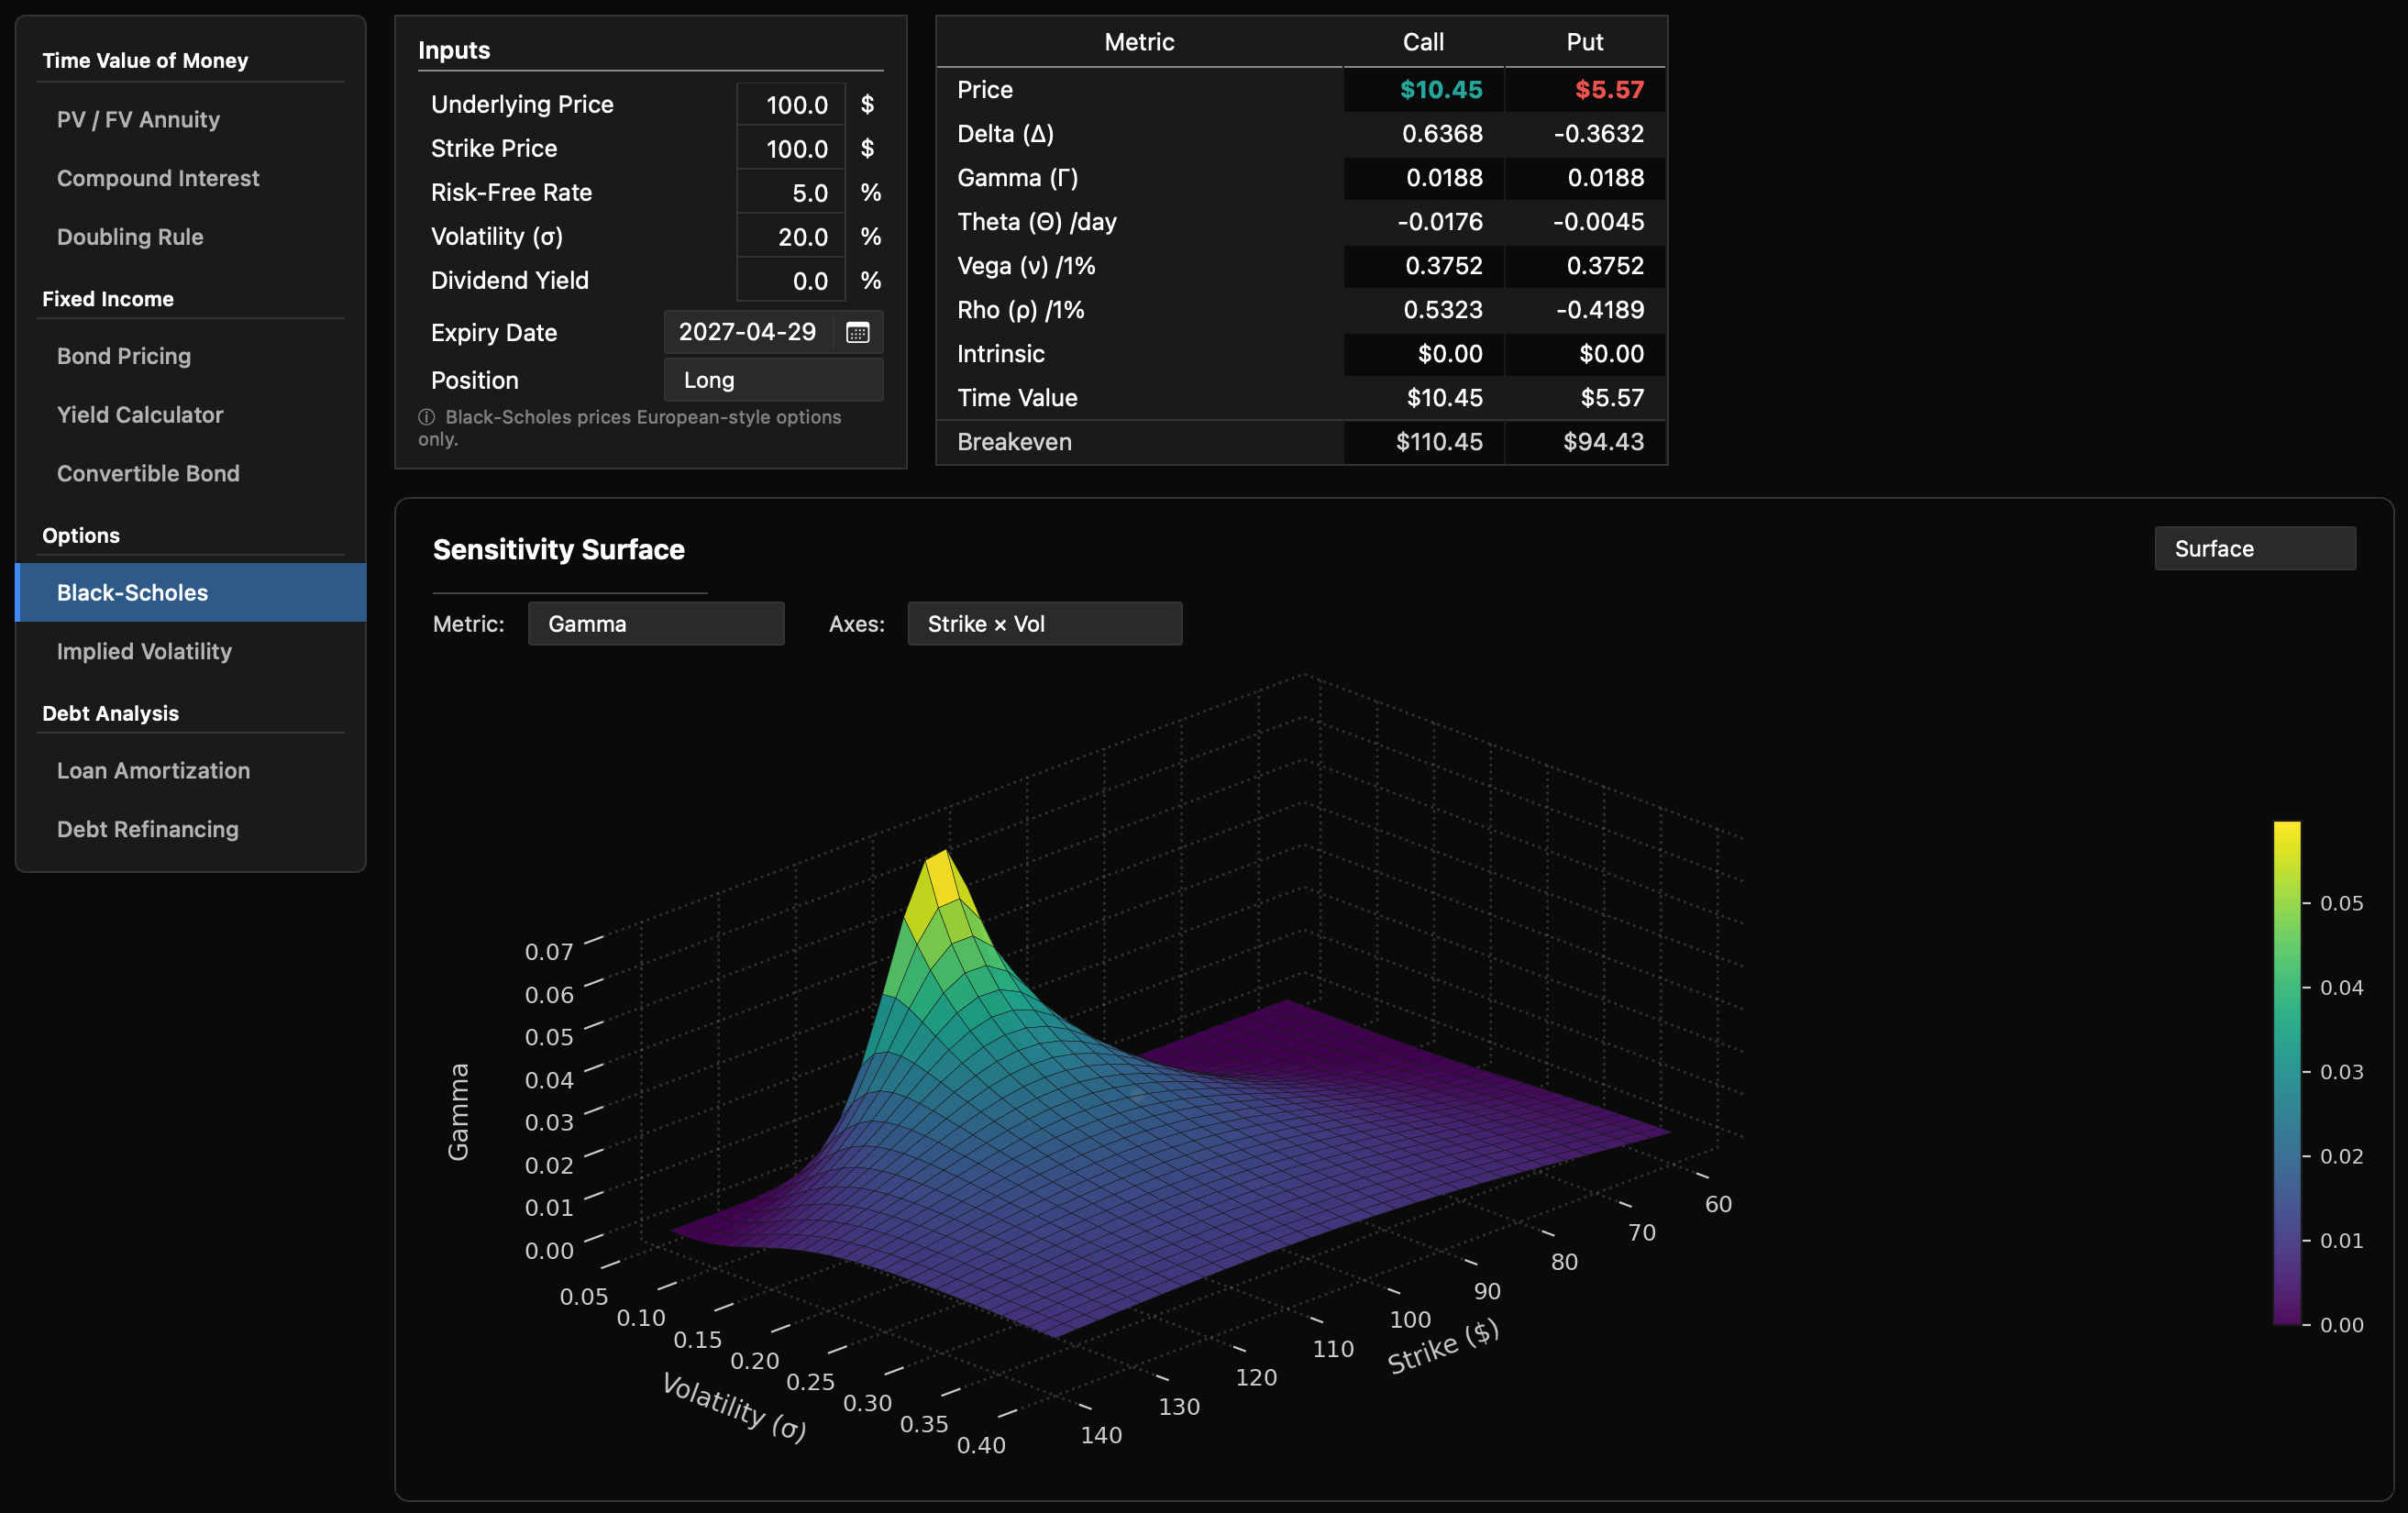
- Time value of money: present value, future value, and interest compounding
- Loan, mortgage, and refinancing analysis
- Derivatives and quantitative tools, including option pricing
Exports
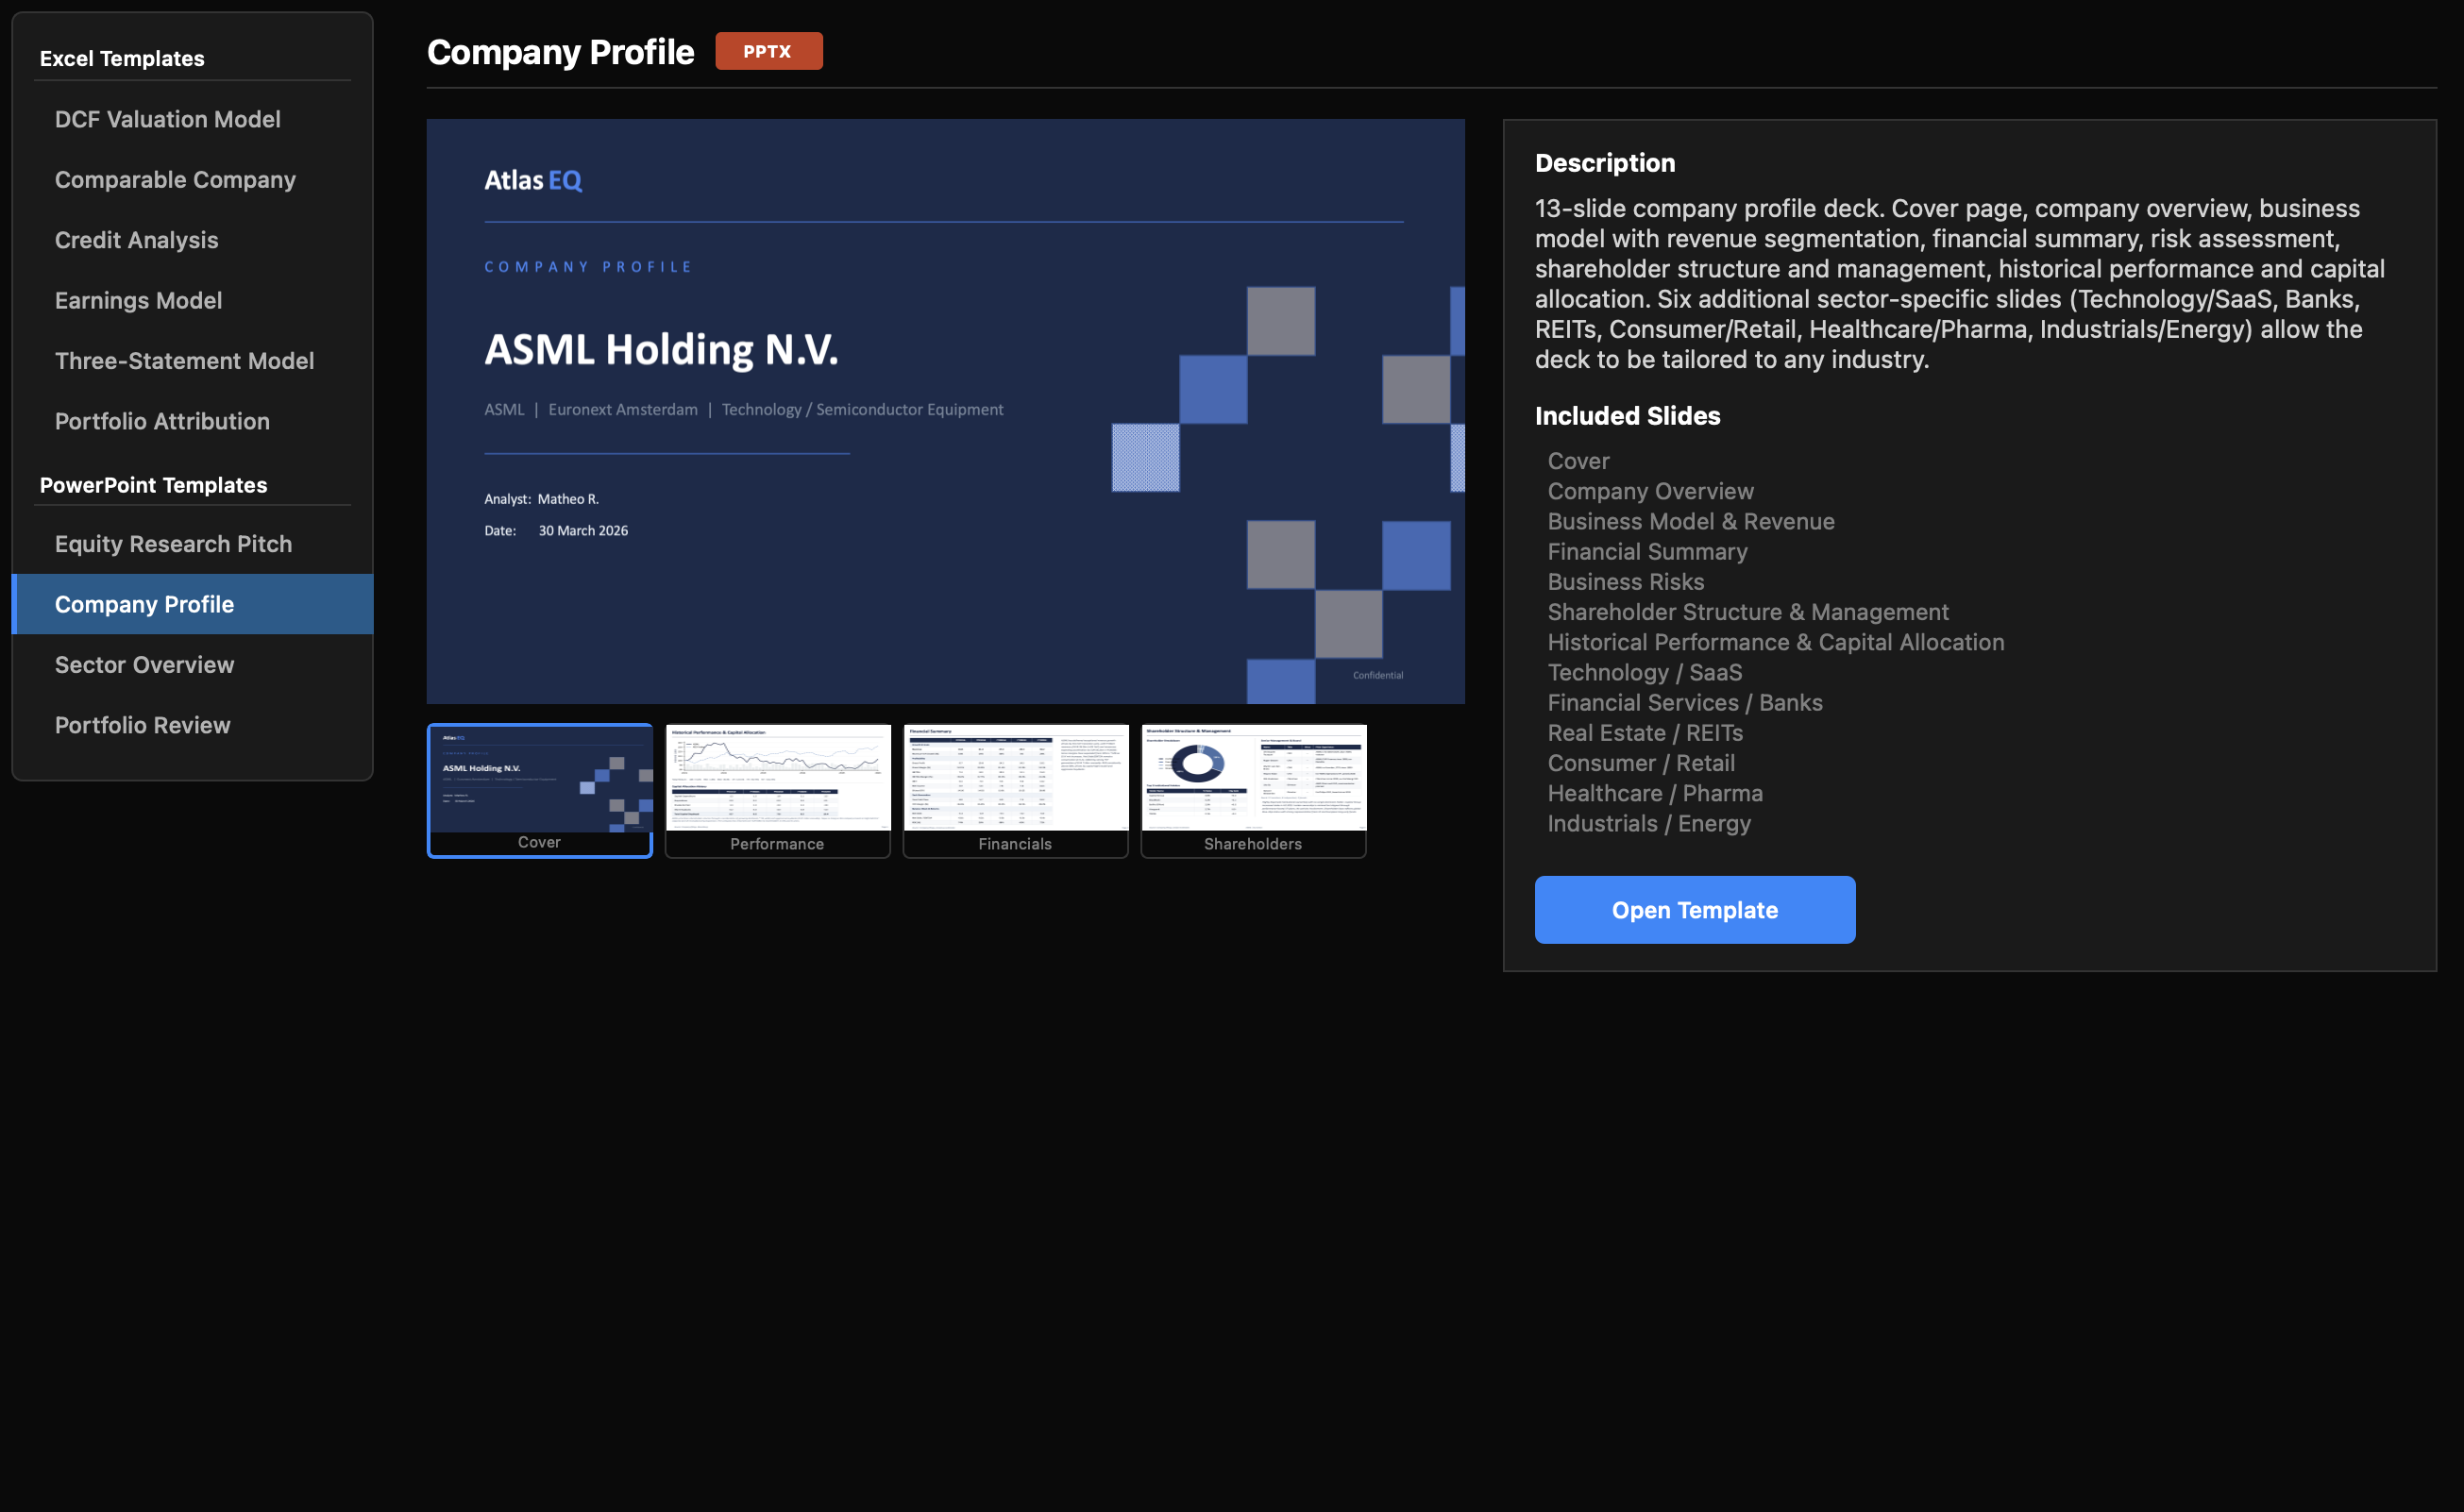
- Pre formatted Excel and PowerPoint files ready to fill in
- Discounted cash flow and comparative analysis Excel templates
- Company analysis presentations formatted for client delivery
Workspace Coming Soon
Research Notes
- Rich text editor
- Version history
- Tags & organization
- Export to PDF & Word